An Evaluation of the Urban Management Supply Chain on the Basis of SCOR Model
Reza Saberi Zanoozi Asl1 * and Tooraj Hasanzadeh2
1
West Departmen,
Payame Noor,
Tehran,
Iran
2
Tehran University,
Tehran,
Iran
http://dx.doi.org/10.12944/CWE.10.Special-Issue1.133
Concurrent with the development of supply chain management concept in different industries, the focus shifted towards evaluation of supply chain performance. A variety of methods is used for evaluation of organizational process performance. One of the most recent methods for this evaluation is Supply Chain Operational Reference (SCOR) model. This study evaluates performance of urban management service supply chain in one of Tehran's municipality departments i.e. Urban Management Department No. 137 by introducing components and indices of Supply Chain Operational Reference (SCOR) and determines an order of priority for main processes of this model in terms of their effect upon improvement in systems and their promotion. The first hypothesis was analyzed by using inferential indices and performing Wilcoxon signed-rank test. The second and third hypotheses were analyzed by performing Friedman test. Our findings suggested that the total supply chain performance level of this department did not reach a satisfactory level.
Copy the following to cite this article:
Asl R. S. Z, Hasanzadeh T. An Evaluation of the Urban Management Supply Chain on the Basis of SCOR Model. Special Issue of Curr World Environ 2015;10(Special Issue May 2015). DOI:http://dx.doi.org/10.12944/CWE.10.Special-Issue1.133
Copy the following to cite this URL:
Asl R. S. Z, Hasanzadeh T. An Evaluation of the Urban Management Supply Chain on the Basis of SCOR Model. Special Issue of Curr World Environ 2015;10(Special Issue May 2015). Available from: http://www.cwejournal.org/?p=11682
Download article (pdf)
Citation Manager
Publish History
Introduction
In wake of customer orientation and lean service focusing on reduction of wastes in organizations of utilities, events such as increase in reliability factor, achievement of longer lifetime of supplied services, reduction of service supply duration, tendency for employment of specialist contractors, and integrity of these corporations within a unitary supply chain encourage these organizations to use efficient models for implementation of this chain and do monitoring for continuous growth and improvement. Supply Chain Operational Reference (SCOR) is one of these models, which makes contribution to evaluation of supply chain on the basis of functional indices, along with implementation and promotion of the supply chain system. Accordingly, with respect to concept and philosophy behind supply chain focusing on planning and organization of products or services from manufacturers to the ultimate consumers in accordance with an integrated system rather than management of independent activities, this study evaluates performance of urban management service supply chain in one of Tehran's municipality departments by introducing components and indices of Supply Chain Operational Reference (SCOR) and then determines an order of priority for main processes of this model in terms of their effect upon improvement in systems and their promotion. We attempt to answer the following questions:
- Is the urban management service supply chain performance of Tehran's municipality in a healthy state?
- What is the order of priority of SCOR's five main processes in the urban management service supply chain of Tehran's municipality?
Therefore, our hypothesis is as follows: There is a significant difference between existing state and an acceptable state of urban management service supply chain in Tehran's municipality.
Review of Literature
Concurrent with a development of supply chain management concept in different industries, the focus shifted towards evaluation of supply chain performance. A variety of methods is used for evaluation of organizational process performance. One of the most recent methods for this evaluation is Supply Chain Operational Reference (SCOR). This process-based model consists of 5 main processes: Planning, resources, make, delivery, and return. Each of these processes contain actions enhancing effectiveness and efficiency of the concerned supply chain. Supply chains involve all actions on purchase of materials, costs and expenses, freight, planning and control of production, logistics, distribution and delivery of products. The supply chain management is an integrated approach to management of supply and distribution of networks such as materials management, services, information, cash, and time for the purpose of reducing actions without any value added, gaining greater commitment to customers, increasing rapidity of supply chain performance, circulating information, reducing production cycle time, and improving manufacturing cycles. The above-mentioned model contains a standard description of managerial procedures, a framework of relationship between standard stages, standard indices for measurement of performance, efficiently managerial methods, and standards of the supply chain performance i.e. standardization of the supply chain performance by using key process indices. Prior to commencement of process of amendment, a clear picture of the existing supply chain structure and the existing procedures should be created and a full awareness should be developed. In next stages, all operations of the supply chain should be analyzed in full details. All these identifications and evaluations need a powerful means such as Supply Chain Operational Reference (SCOR) (Supply chain operations reference (SCOR) model, Overview version 10.0, Supply chain council (SCC), 2013).. This model, offered by supply chain council i.e. a standard reference for supply chain management, helps corporations enhance the effectiveness of their supply chains and create a process-based attitudes towards SCM. This model was introduced by supply chain council (1996) and its tenth version was also published, which is supported by 1000 corporations. SCOR is an inter-industrial standard for the purpose of establishing effective relationship among supply chain partners and helping directors and managers analyze their supply chains and identify opportunities for improvement in materials, works, and information. SCOR generates upward and downward waves surrounding the supply chain, by defining it as an integrated process of planning, resources, construction, delivery, and return for balancing multiple links within this chain (Supply chain operations reference (SCOR) model, Overview version 10.0, Supply chain council (SCC), 2013)..
This model contains a standard description of managerial procedures, a framework of relationship between standard stages, standard indices for measurement of performance, efficiently managerial methods, and standards of the supply chain performance. It creates a balance between the horizontal perspective (an inter-procedural trend) and vertical perspective (a hierarchy of processes). Accordingly, organizations are allowed to play a significant role in improvement in general performance of the chain supply, by using a shared terminology. SCOR is the first method for formation of a supply chain on the basis of business strategy. It utilizes well-known concepts of approaches to reengineering of business process and measurement of performance within an integrated framework. Moreover, by identifying the existing state of each process, it proposes an improved manner and determines operational objectives for each process with regard to indices of performance in similar corporations. SCOR is a reference model, which provides a framework for effective actions within the supply chain. It begins from suppliers of suppliers and ends with customers of customers and involves 4 main managerial actions: Planning, resources, construction, and delivery. In other words, this model creates a standard and shared process-based language among partners and beneficiaries of a supply chain. Since the fifth version of this model, the area of return was inserted for considering environmental concerns, which is an indication of reverse logistics in the general cycle of supply chains.
This model defines a variety of standards for the supply chain performance including general indices and detailed operational indices. Fundamental indices measuring and explaining the general chain performance are Key Performance indicators (KPI). These KPIs involve more operational indices due to hierarchical nature of SCOR. For instance, the delivery performance index has two sub-criteria including on-time delivery which is defined as percent of orders delivered on time or sooner (Supply chain operations reference (SCOR) model, Overview version 10.0, Supply chain council (SCC), 2013).. Additionally, SCOR contains a hierarchical structure of standard processes in order to offer a modelling for a supply chain from providers of materials and devices to ultimate customers of products. This structure is three-leveled, including typology of processes, classification of processes, and elements of processes. Typology of processes is an indication of SCOR's wide scope, which involves five general actions i.e. planning, resources, construction, delivery, and return. These actions are located within different levels of operational strategy, with regard to policy of construction. Decisions on formulation of objectives establish an operational strategy. The following questions are asked about this establishment:
- Do you select manufacturing for stock, manufacturing for order, engineering of an order, or all of them?
- Do you believe cost-reduced construction strategy?
- Do you tend to form your ultimate configuration outside the manufacturing space and near to customers?
The responses are significant to investments and whole supply chain. Also, an operational strategy suggests how persons should be attracted, how factories and stores should be set up, and how systems of information should be designed.
Make to Stock
This strategy is the most efficient plan in cases of best-selling standardized products. It increases productivity and decreases manufacturing costs. Availability of goods in stokes is an indication of an immediate demand.
Make to Order
This strategy is the most efficient plan in cases of customized products with low demands. Corporations pursue this strategy when goods are ordered by customers. A limited range of products but with a distinct facilities is stored in the stock.
Configure to Order
It is a hybrid strategy of construction in a way that a manufacturing stage is reached and the next stage is moved through in case of customers' order. This strategy is used in cases of big changes in the ultimate product, tendency for lower range of products in the stock, and reduction of time for fulfillment of customers' demands.
Engineering to Order
It has similarity to make-to-order strategy, which is used in cases of complicated goods and services and responsiveness to specific demands of customers.
Each of these classifications of processes has their own procedural elements including inputs, process, outputs, indices of performance, and informational requirements. Some of these elements are as follows:
Process of Planning: Management and planning of supply and demands:
- Balance among resources and requirements for implementing SCOR's model;
- Management of business rules, the supply chain performance, collection of information, stock, capital, transportation and complaints; and
- Consistency of the supply chain with financial strategies of the organization
Process of Resource-finding: Management of operational manufacturing strategies including Make to Stock (MTS), Make to Order (MTO), Engineering to Order (ETO), and Configure to Order (CTO):
- Timelines of transportation, delivery, receipt, and confirmation of products as well as confirmation of supplier's payment;
- Identification & selection of provider's resources in cases of order engineering;
- Evaluation of Supplier's performance; and
- Management of assets, input products, supply networks, import and export, agreements with suppliers
Process of Construction: Implementation of operational manufacturing strategies
- Process of manufacturing, testing, and confirmation, packaging of stock, delivery of products, and management of construction tools and machinery; and
- An ultimate engineering of operational manufacturing strategies and customized engineering
Process of Delivery: Management of orders, stock, transportation, and installation
- Management of orders; and
- Management of transportation & issuance of manufacturing notices; and
- Monitoring confirmation and delivery of products, their installation (if necessary), and issuance of invoice
Process of Return or Reverse Logistics in cases of raw materials or ultimate products:
- Management of customer's complaint;
- Guarantee & Warrantee; and
- After-sale services
One of SCORE's components in higher levels is a set of performance evaluation indices, as Table 1 shows.
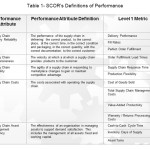 |
Table1: SCOR's Definitions of Performance Click here to View table |
- On-time delivery: A proportion of orders fulfilled in a given period of time to total of orders;
- Lead time of order fulfillment: A proportion of required time period for fulfillment of orders (from time of purchase to time of delivery) to total of orders;
- Fill Rates: A proportion of dispatch for fulfillment of orders to total of received orders within 7 days;
- Perfect Order Fulfillment: A proportion of full satisfaction of customers to the total poll;
- Supply Chain Response Time: A required time for encouragement of supply chain integration in cases of sudden changes in demands
Service Flexibility: it consists of two parts:
Upper Flexibility: An analysis of received complaints, a determination of %20 of potential complaints, and a fulfillment of demands before receiving further complaints; and
Lower Flexibility: A percentage of urban services per one month in compliance with full satisfaction of customers
Costs of Goods Sold- Total Supply Chain Management Cost;
- Return processing cost: Costs incurred by providing false services
- Value added of employee productivity: A proportion of number of employees in the supply chain to general percentage of customers' satisfaction and incurred costs;
- Inventory days of supply: Proportion of owned and/or mortgaged machinery and physical inventory to machinery of contractors for supplying services;
- Cash-To-Cash cycle time: A proportion of costs paid to contractors for supplying urban services to satisfaction of customers as a returned capital;
- Asset Returns: A proportion of costs as tax duties and for renovation of households in municipality districts to satisfaction of customers (Supply chain operations reference (SCOR) model, Overview version 10.0, Supply chain council (SCC), 2013)..
The Study Population
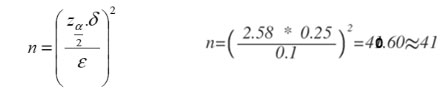
The population consisted of supply chain experts in Urban Management Department No. 137 of Tehran's municipality. As regards the sample size, we distributed 15 questionnaires among the selected experts and then we estimated sample size by using the below equation with regard to standard deviation of 0.25 in %99 level of confidence, and a distance of 0.1. Next, other 26 questionnaires were distributed among experts.
In any research, a collection of real information is significant to accomplishment of the research objectives. The researchers gathered information concerning theoretical principles of the study by using library resources and taking notes. Also, the required data on analysis of hypotheses were collected by distributing questionnaires including 13 question items. Answer items were put into Likert Scale. The reliability of questionnaires was assessed by employing method of Cronbach's Alpha. The calculated reliability was 0.86. As Nunnally points out, a value greater than 0.7 is reliable. Accordingly, questionnaires were sufficiently reliable.
Urban Management Department No. 137 of Tehran's Municipality
The most crucial duty of Tehran's municipality as a social organization is urban unit management. Due to awareness of recent developments in business and social relations, this organization has made enormous efforts in order to accomplish main managerial objectives by applying information technology. Undoubtedly, modern urban sites in area of management, implementation, and monitoring are efficient ways and means in this regard (Manual of Urban Management Department No. 137 2013)..
Urban Management Department 137 is a channel of communication for establishing an easy, equal, and round-the-clock communication with the public, gaining awareness of people's demands, and making the respective authority figures informed of their requests, in compliance with principles of accuracy, concision, and rapidity. This department was established in the form a voice mail in 2000 and changed into a center of control and organization of urban problems in winter of 2005.
Tehran's citizens can submit their requests to this department in 800 matters of concerns. General outline of these requests are as follows:
- Urban Services (425 topics; %54)
- Transportation & Traffic (141 topics; &17.91)
- Socio-cultural Concerns (123 topics; %15.62)
- Financial-administrative Concerns (53 topics; %6.73)
- Urbanization & Architecture (30 topics; %3.81)
- Technical-developmental Concerns (15 topics; %1.92)
Urban Management Department No. 137 attempts to change into a headquarter of urban management by making main national decisions and covering all utilities including municipality, electricity, water, gas, telephone, etc. (Manual of Urban Management Department No. 137 2013)..
Analysis of Hypotheses
The first hypothesis was analyzed by using inferential indices and performing Wilcoxon signed-rank test. This test is performed when one group of the concerned population is selected as sample and then this group is examined in terms of pre- and post- changes of some independent variables. Accordingly, a comparison was made between the existing state and the acceptable state, by using the collected data (533 items of information on 13 persons, collected from 41 respondents).
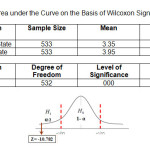 |
Table 2: Area under the Curve on the Basis of Wilcoxon Signed-rank Test Click here to View table |
In %95 of error rate and on the basis of Normal Distribution Table, the critical value is 1.96. As value of Z is not placed between +1.96 and -1.96, the hypothesis is rejected. Accordingly, with regard to a %95 level of confidence, H0 is rejected and H1 is accepted. To put it differently, there is a significant difference between existing state and an acceptable state of urban management service supply chain in Tehran's municipality. Table 3 shows all defined dimensions of the supply chain.
Table 3: General Results if The Analysis
|
|
Sample Size |
Mean |
Value of Z |
Level of Significance |
High Level |
Low Level |
results |
|
On-time delivery |
41 |
3.20 |
-3.959 |
0 |
+1.96 |
-1.96 |
H0 is rejected; H1 is accepted |
|
Fill Rates |
41 |
2.93 |
-4.657 |
0 |
+1.96 |
-1.96 |
H0 is rejected; H1 is accepted |
|
Order Delivery Time |
41 |
3.24 |
-2.782 |
0.050 |
+1.96 |
-1.96 |
H0 is rejected; H1 is accepted |
|
Perfect Order Fulfillment |
41 |
3.12 |
-4.772 |
0 |
+1.96 |
-1.96 |
H0 is rejected; H1 is accepted |
|
Supply Chain Response Time |
41 |
3.24 |
0.491 |
0.623 |
+1.96 |
-1.96 |
H0 is accepted; H1 is rejected |
|
Service Flexibility |
41 |
3.17 |
-4.841 |
0 |
+1.96 |
-1.96 |
H0 is rejected; H1 is accepted |
|
Costs of Goods Sold |
41 |
3.46 |
-4.054 |
0 |
+1.96 |
-1.96 |
H0 is rejected; H1 is accepted |
|
Total Supply Chain Management Cost |
41 |
3.46 |
-4.290 |
0 |
+1.96 |
-1.96 |
H0 is rejected; H1 is accepted |
|
Value added of an employee's productivity |
41 |
3.78 |
-2.985 |
0 |
+1.96 |
-1.96 |
H0 is rejected; H1 is accepted |
|
Reverse Logistics |
41 |
3.44 |
-4.038 |
0 |
+1.96 |
-1.96 |
H0 is rejected; H1 is accepted |
|
Time of Supply |
41 |
3.32 |
-4.585 |
0 |
+1.96 |
-1.96 |
H0 is rejected; H1 is accepted |
|
Cash-To-Cash cycle time |
41 |
3.49 |
-3.925 |
0 |
+1.96 |
-1.96 |
H0 is rejected; H1 is accepted |
|
Turnover of Capital |
41 |
3.34 |
3.851 |
0 |
+1.96 |
-1.96 |
H0 is rejected; H1 is accepted |
Table 4: Ranking of Processes on the Basis of Friedman Test
|
Variables |
Priority |
Mean of Ranks |
|
Planning |
3 |
2.93 |
|
Delivery |
1 |
2.73 |
|
Resources |
4 |
3.09 |
|
Service Supply |
2 |
2.85 |
|
Reverse Logistics |
5 |
3.40 |
Conclusion
Analysis of questionnaires revealed that most dimensions of the supply chain performance in Urban Management Department No. 137 are not in an acceptable state. These dimensions are on-time delivery, fill rates, order delivery time, perfect order Fulfillment, supply chain response time, service flexibility, costs of goods sold, total supply chain management cost, value added of an employee's productivity, reverse logistics, time of supply, cash-to-cash cycle time, and turnover of capital. Consequently, the total supply chain performance level of this department did not reach a satisfactory level. This department's performance and quality of services can be improved by enhancing organizational effectiveness and achieving organizational excellence because organizational effectiveness is significantly and positively interrelated with satisfaction of citizens. Higher levels of effectiveness bring greater satisfaction of citizens.
Priority of the conceptual model's main components was determined by performing the Friedman test. This test shows mean ranks of variables. The higher a variable ranks, the more significant that variable is.
Ranking of the considered variables in terms of importance and effectiveness is done by performing Friedman's variance test. The critical value is 9.478 with regard to chi-square table, degree of freedom i.e. 4, and %5 level of confidence. As the calculated value is less than the table value, the studied experts have identical viewpoints on five processes of Urban Management Department No. 137. Therefore, ranking can be done and H0 is accepted. As results of Freidman test show, hypothesis 2 and hypothesis 3 are rejected. In view of these persons, reverse logistics and delivery are respectively the most effective and the least dimensions of Urban Management Department No. 137. Table 4 shows the results.
This ranking shows that reverse logistics put in the most satisfactory performance. Therefore, this dimension does not require a detailed planning for improvement. Conversely, dimension of delivery should be improved to the greatest extent.
Suggestions for a Further Study
According to results of Wilcoxon signed-rank test and unsatisfactory dimensions of the supply chain in Urban Management Department No. 13, we put forward some suggestions for improvement of organizational performance:
- Determining performance indices for control of growth and development, preparing monthly reports, and holding sessions for management review;
- Holding regular problem-solving sessions and proposing strategies in accordance with order of priority and rules of 20 to 80;
- Categorizing difficulties;
- Involving citizens in offer of suggestions;
- Assessment of customers' satisfaction by distributing questionnaires after service supply;
- Making a relationship between contractors' performance and customers' satisfaction;
- Offering urban services to other regions for optimization of resources and enhancement of efficiency;
- Formulating strategies for neutralization of false service costs;
- Establishing a strong communication network with citizens; and
- Establishing an integrated knowledge management for other regions
References
- Supply chain operations reference (SCOR) model, Overview version 10.0, Supply chain council (SCC), 2013.
- Manual of Urban Management Department No. 137 (2013).


